Time Travel over a USB Cable: PocketJS DevTools
A component inspector that highlights on the PSP's physical screen, pause/step for the whole world, a REPL into the handheld — and time-travel debugging where a session is two bytes per frame, carried over PSPLINK, the homebrew scene's answer to the GDB remote stub.
Written by Yifeng "Evan" Wang
PocketJS just grew a DevTools. Not a log viewer — a component inspector that highlights nodes on the PSP's physical screen, pause and single-step for the entire world, a REPL into the running handheld, the first working console.log the machine has ever had, and time-travel debugging in which a whole session is two bytes per frame. All of it reaches real hardware through one USB cable and starts with one command:
bun run devtools cards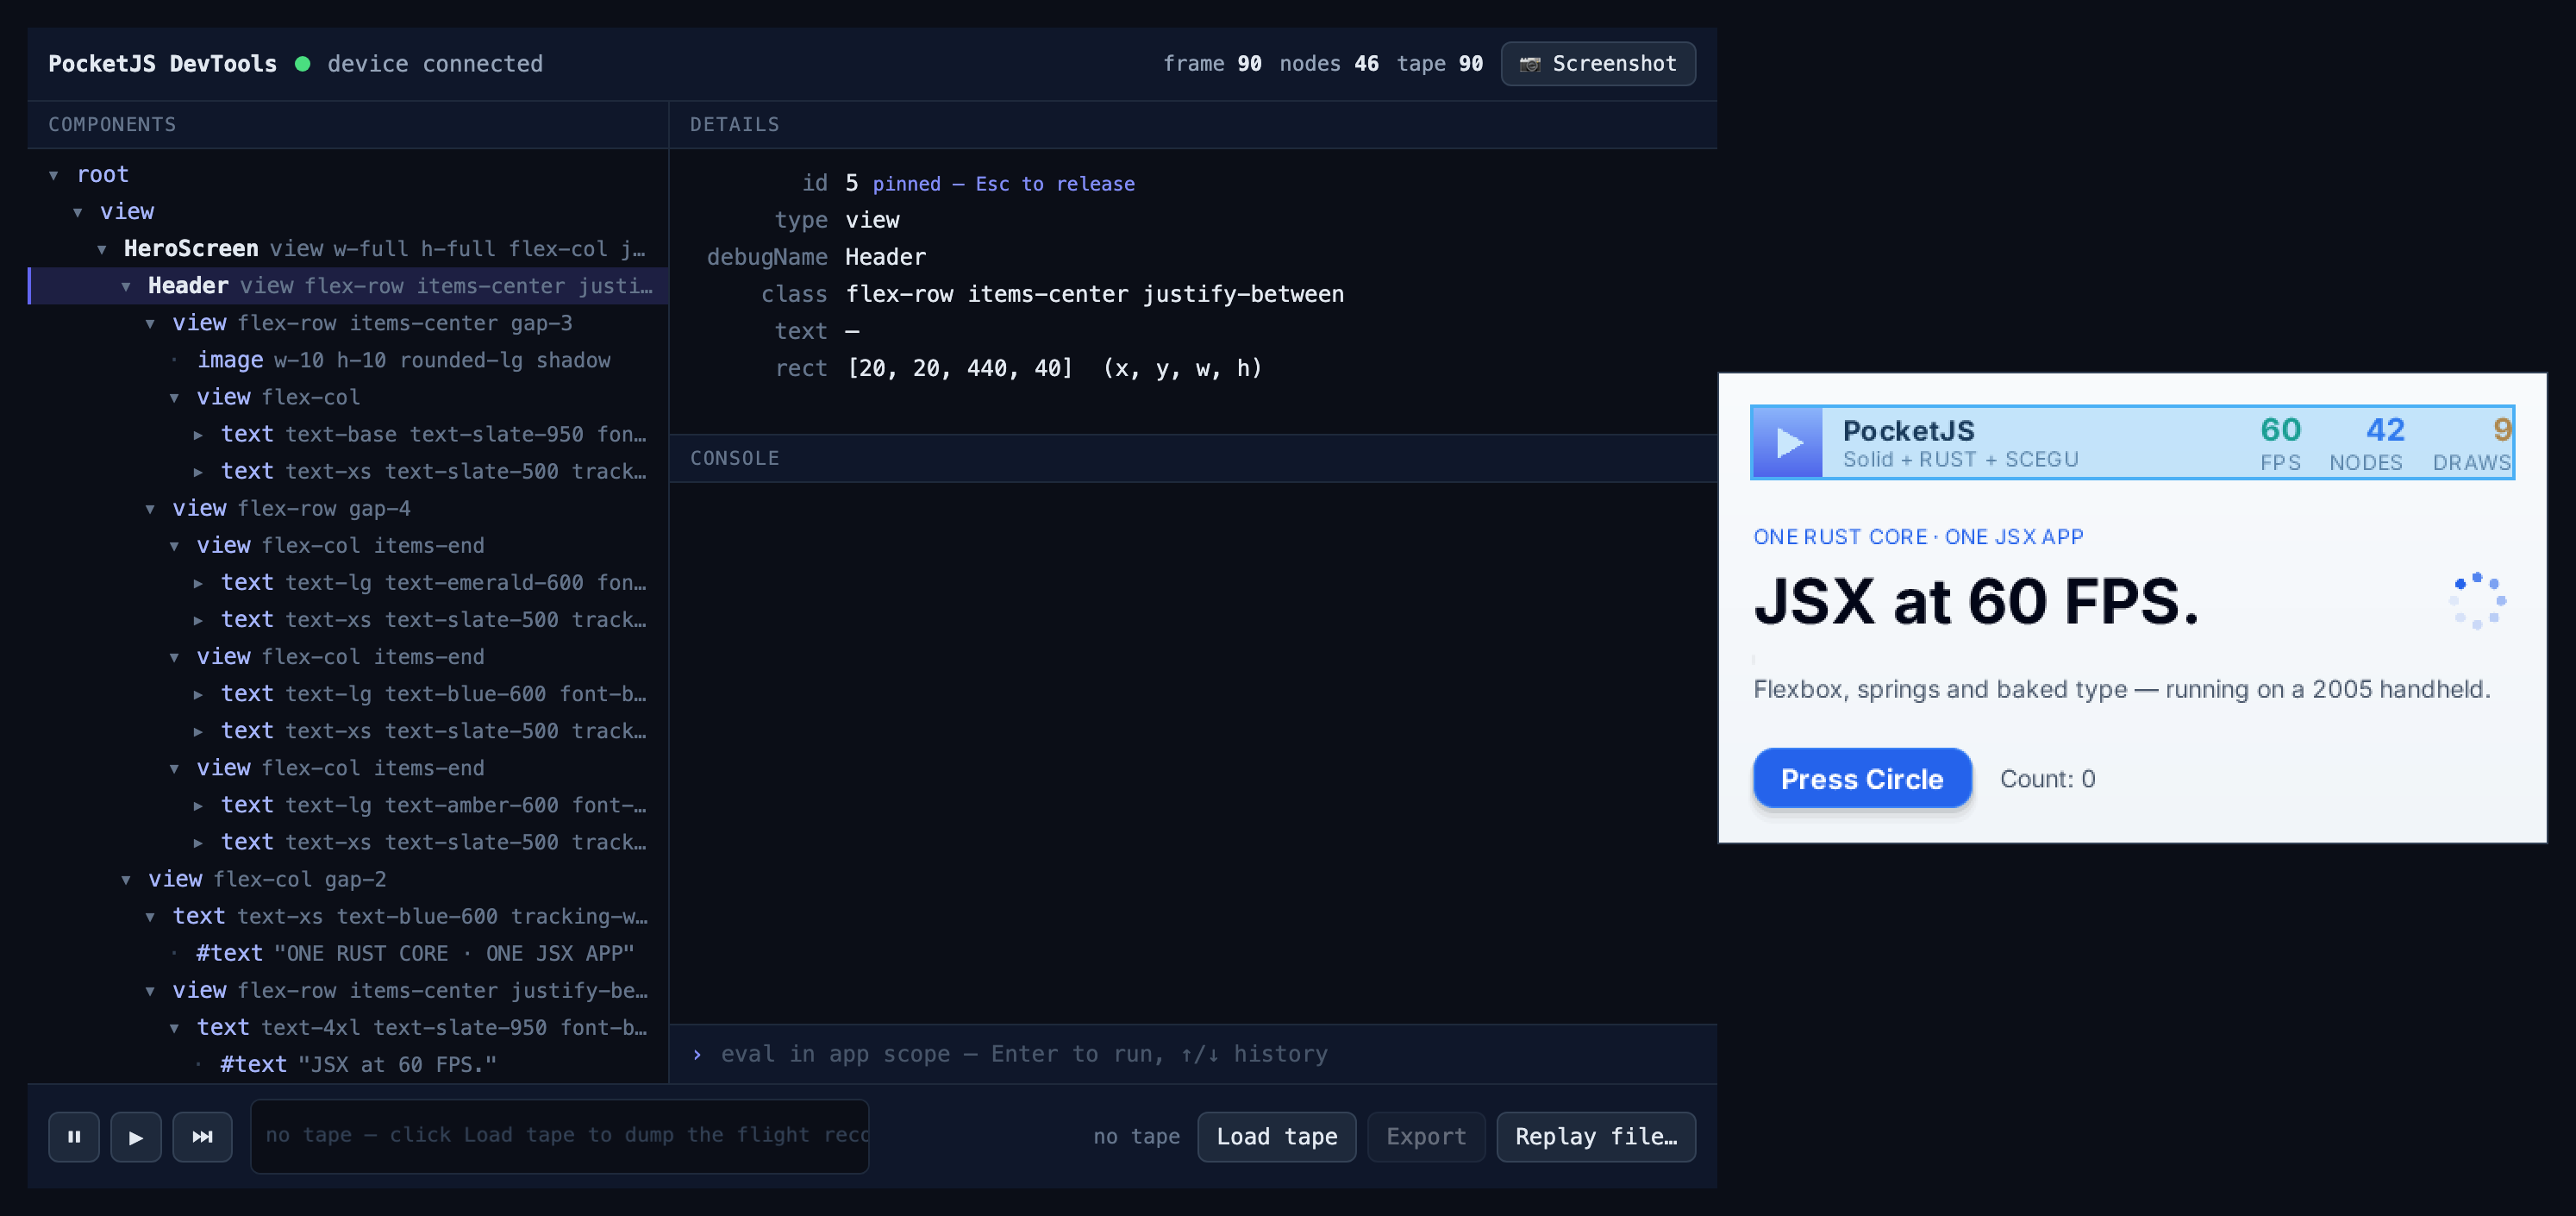
Pin Header in the component tree on the left, and the header lights up on the device on the right. The device side of that image was not composited in an image editor — it is the engine's own output: the highlight is drawn by the renderer, which is why the same hover works identically on the PSP's GPU, in WebAssembly, and headless under Bun. This post is about the three ideas underneath — a world small enough to record, a debugger that draws with the engine, and a 20-year-old USB protocol doing the job GDB stubs have always done.
The world in two bytes a frame
PocketJS is a closed world by construction. The core ticks a fixed 1/60 s step; animation clocks count frames, never wall time; the runtime bans Math.random, wall clocks and schedulers; and the entire per-frame input — d-pad, buttons, triggers — is one integer bitmask handed to globalThis.frame(buttons). Frame content is a pure function of frame index. That property already powered our byte-exact golden tests. DevTools weaponizes it:
the input tape is the application state.
Record the mask each frame — a u16, so ten minutes of play is about 70 KB — and any session replays byte-for-byte: same pixels, same tree, same bug. Every PocketJS bundle now runs a flight recorder unconditionally (it costs one array write per frame), which turns "what just happened?" into an exportable artifact:
bun run tape replay cards-main crash.tape.json --png 4120   # render the bad frame
bun run tape replay cards-main crash.tape.json --hashes h.json
bun run tape replay cards-main crash.tape.json --assert h.json
# tape: FIRST DIVERGENT FRAME 4118 — expected 91ec0f11, got 5b02a377
A bug report becomes pak + tape + frame index — executable evidence. Replay the same tape against a new build and --assert names the exact frame where behavior changed; check the tape into tests/, and a real user session becomes a regression test that every future build must replay pixel-perfectly. We ship one in the repo (bun run tape:check): 180 frames of scripted interaction, verified on every change.
Open-world frameworks cannot follow here — not because their tooling is worse, but because their worlds leak. A browser page drinks nondeterminism from everywhere: timers, network, GC pauses, Date.now() in a render. Redux-era time travel recorded actions precisely because it could not trust the world around them. PocketJS records sixteen buttons, and trusts everything else to physics.
A debugger that draws with the engine
The inspector's data side was almost free: the reconciler already maintains a JavaScript mirror of the native tree (reads never cross the FFI), so the component tree, classes and text were sitting there waiting to be serialized. Components tag themselves with semantic names — a debugName prop on any primitive, or a <Named> wrapper around a subtree — so the panel reads like your source, not like DOM soup.
The interesting half is the highlight. DevTools overlays in browsers are separate DOM layered on top. Ours is four rectangles and a translucent fill appended to the engine's own DrawList, after the paint walk captures the hovered node's world-space bounding box — transforms and all. Because it rides the normal command stream, every backend renders it with zero extra code: the sceGu path on hardware, the software rasterizer in wasm, the wgpu desktop window. Hover a node in the desktop panel and the region lights up on the handheld in your hands.
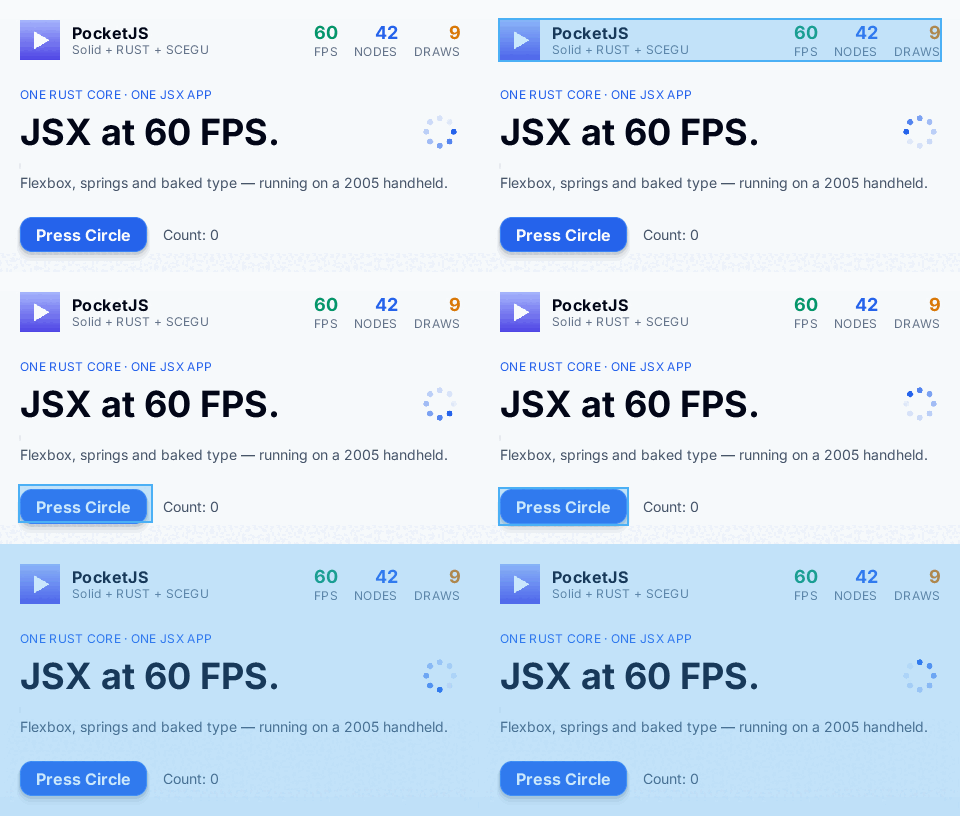
And it moves. Click a different node and the box glides there — an exponential ease computed in the renderer, one lerp per frame, converging in about a hundred milliseconds. It costs nothing (the box was being re-emitted every frame anyway), it tracks nodes that are themselves animating, and because it lives in draw() rather than tick(), it keeps gliding even while the world is frozen at a breakpoint. Your eyes follow the motion to the new region instead of scanning for a teleported outline — the same trick Android Studio's Layout Inspector plays, running on a machine with 32 MB of RAM.
Pause works the same way — in the core, not in JavaScript. The PSP's main loop is Rust; it calls tick() whether or not scripts approve. So debugPause makes tick() itself a no-op: the frame counter, every timeline, every spring and sprite clock freeze as one, and draw() keeps running so the highlight stays live inside the frozen frame. Step advances the universe by exactly 1/60 s. Between frames the world is quiescent — microtasks drained, layout settled — which makes the REPL honest: eval inspects real state, not a race.
The cable: GDB's ghost on a handheld
The part most readers will not have seen before is how any of this reaches a 2004 games console. There is no adb here, no WebSocket server on the device. There is PSPLINK — and PSPLINK is best understood as a member of a very old family.
Remote debugging has had the same shape since the serial-port era: a tiny stub on the target, a smart client on the host, and the dumbest wire you can get away with. GDB's remote serial protocol is the canonical form — $g#67 over a UART, the debugger on your workstation doing all the thinking while the stub just reads and pokes. Every console homebrew scene eventually rebuilds this shape, because dev hardware is scarce and retail hardware is locked.
The PSP scene got there via custom firmware. CFW (the Dark_AleX lineage) exists so the machine will run unsigned code at all; once it does, the pspdev toolchain's PSPLINK loads a resident module that gives your desktop two primitives over the USB cable:
pspsh— a shell into the device: load a module, reset, poke around. (PSPLINK even ships an actual GDB stub, completing the family portrait.)usbhostfs— the inversion that makes it brilliant: the PSP mounts a directory of your desktop as itshost0:filesystem. The dev loop stops being "burn to Memory Stick"; the device just runs your build output in place.
Our debug channel keeps the stub/client shape and swaps the payload. The device-side stub is a few hundred bytes of logic: every ten frames, read new lines from host0:/pocketjs-dbg/in.jsonl; append replies to out.jsonl. Two append-only files on a mounted filesystem, acting as the two halves of a duplex pipe. The file is the wire. On the desktop, a bridge tails one file, appends to the other, and speaks WebSocket to the panel. No sockets on the device, no threads, no interrupt handlers — sceIoRead a few times a second, which the console does not even notice at 60 FPS.
The payload is where we part ways with GDB. A register-level stub answers questions about a machine; ours answers questions about a UI framework — getTree, inspect, pause, eval, dumpTape. Same transport physics, twenty years apart, one level of abstraction up.
Two consequences fall out for free. console.log on the PSP had never existed — the runtime stubs it to nothing — but with a transport attached, logs and stack traces stream off the handheld with frame numbers attached, and a frame number plus the tape is a reproduction. And screenshots stay off the JSON channel entirely: on demand, the device dumps its live framebuffer — 557 KB of raw VRAM — straight to host0:, and the desktop bridge converts it to PNG. One button in the panel, an Android-Studio-style capture, from hardware that predates Android.
One command
Tooling this stack used to mean three terminals; now the panel server, the WS hub, the USB bridge and the device session are one process with a vite-shaped face:
$ bun run devtools cards

  ⚡ Pocket DevTools ready in 21 ms

  ➜  Panel:  http://127.0.0.1:8130/devtools
  ➜  Demos:  http://127.0.0.1:8130/
  ➜  PSP:    waiting for the PSP on USB… launch PSPLINK on it (XMB → Game)

  press o open panel · r rebuild + relaunch · q quit
It builds the EBOOT, serves it over usbhostfs, launches it through pspsh, and bridges the mailbox — and if you already have a bun psplink session owning the cable, it detects that and bridges into it instead of fighting for USB. The panel gives you the tree with hover-highlight, pause/step, the input-tape strip with click-to-seek (the browser host reloads and fast-forwards deterministically — tick without render — to any frame), the REPL, the log stream, and the 📷 button.
Built for people, load-bearing for agents
There is a second audience for all of this. A meaningful share of PocketJS is written by AI agents, and an agent cannot feel the d-pad or glance at the screen — it debugs exactly as well as its questions are answerable from a terminal. That constraint turns out to be a forcing function for good architecture: every panel capability is also a headless one. tape replay --png renders any frame of any session to an image; tape tree --at prints the component tree at frame N as JSON; --assert bisects a regression to the frame. The protocol does not care whether the client is a human with a mouse or a model with a shell.
The determinism that makes the PSP build reproducible is the same determinism that makes a bug report executable, a session a test, and an agent a competent debugger. One property, compounding.
The design doc — including what's next: memory-snapshot I-frames for O(1) scrubbing, tapes in playground URLs, a causality index from pixel back to input edge — lives in docs/DEVTOOLS.md. The code is on GitHub, MIT, and npm install -g @pocketjs/cli gets you pocket devtools.